







What Is Bitcoin Dominance? The Complete Guide to Crypto’s Most Critical Metric

In digital asset trading, few metrics carry as much weight—or spark as much debate—as Bitcoin Dominance. Tracked globally under the ticker BTC.D, this percentage provides a high-level snapshot of market psychology, capital allocation, and macro risk appetite across the cryptocurrency sector.
For early digital asset investors, tracking Bitcoin was straightforward: Bitcoin effectively was the market. However, as the ecosystem expanded into thousands of alternative digital assets, smart contract platforms, and stablecoin networks, measuring relative market share became indispensable.
Whether you are an institutional portfolio manager rebalancing spot allocations or an active trader waiting for the next “altcoin season,” understanding Bitcoin Dominance is essential for decoding market momentum. This guide explores the mechanics of BTC.D, its historical evolutions, structural limitations, and how to apply it effectively within a modern market framework.
Understanding Bitcoin Dominance (BTC.D)
At its core, Bitcoin Dominance measures Bitcoin’s market capitalization relative to the combined market capitalization of the entire cryptocurrency asset class. Expressed as a percentage, it illustrates how much of the crypto market’s aggregate value resides within Bitcoin alone.
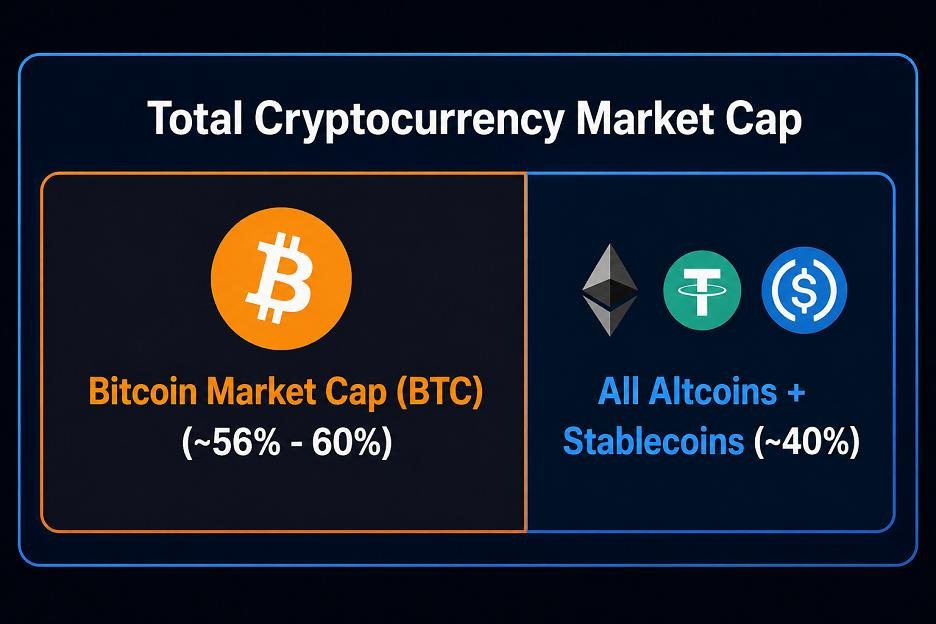
When BTC.D trends upward, capital is concentrating into Bitcoin faster than the rest of the market—a classic indicator of “risk-off” sentiment within the sector or targeted institutional inflows. Conversely, when BTC.D declines, capital is spreading outward into alternative cryptocurrencies (altcoins) like Ethereum, Solana, and emerging protocols, signaling heightened market-wide risk tolerance.
How to Calculate Bitcoin Dominance
The mathematical formula for Bitcoin Dominance is simple:
Bitcoin Dominance (%) = (Bitcoin Market Capitalization ÷ Total Cryptocurrency Market Capitalization) * 100
Practical Example
To calculate market share in real time, consider a hypothetical total market scenario:
| Metric | Value (USD) |
| Bitcoin Circulating Supply | $19.7 Million BTC |
| Bitcoin Price | $68,000 |
| Bitcoin Market Cap | $1.3396 Trillion |
| Total Crypto Market Cap | $2.3500 Trillion |
Applying the formula:
BTC.D = ($1.3396 Trillion ÷ $2.350 Trillion) * 100 = 56.98%
Major market data providers like CoinMarketCap, CoinGecko, and TradingView automatically calculate and stream this metric continuously.
The Evolution of BTC.D: A Historical Perspective
Bitcoin Dominance has undergone distinct structural regimes since the creation of the genesis block in 2009.
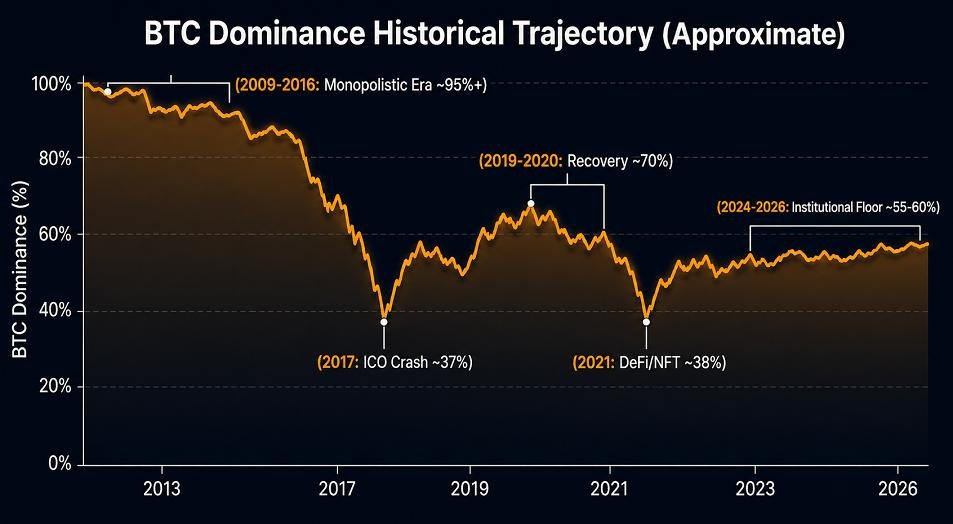
1. The Monopolistic Era (2009–2016)
In crypto’s early years, Bitcoin maintained near-total market exclusivity, rarely dipping below 85% to 95% dominance. Alternative assets were predominantly direct Bitcoin forks (such as Litecoin or Namecoin) with limited liquidity and modest adoption.
2. The ICO Boom and First Great Dilution (2017–2018)
The public launch and maturation of Ethereum enabled smart contract execution and native token creation (ERC-20). In 2017, thousands of Initial Coin Offerings (ICOs) flooded the market. As retail capital rushed into speculative altcoins, Bitcoin’s dominance experienced an unprecedented decline from over 85% in early 2017 to an all-time low near 37%–38% in January 2018.
3. The Flight to Quality and DeFi Summer (2019–2021)
During the 2018–2019 bear market, speculative altcoins lost 90% or more of their dollar value, causing capital to return to Bitcoin and pushing BTC.D back toward 70%. However, the rise of Decentralized Finance (DeFi) in mid-2020 and the 2021 NFT expansion triggered a second altcoin boom, pulling dominance back down toward the 38% level by mid-2021.
4. The ETF Era and Institutional Maturity (2024–2026)
The regulatory approval of spot Bitcoin ETFs in major financial jurisdictions marked a structural shift. Institutional inflows through regulated vehicles provided persistent buying demand, driving BTC.D back up from sub-40% lows into a sustained 55%–60% range.
Key Drivers Behind Bitcoin Dominance Shifts
Understanding why dominance moves requires analyzing three underlying forces: market sentiment, technological developments, and macro conditions.
Market Sentiment and Risk Appetite
-
Risk-Off (Flight to Safety): During market panics, macroeconomic uncertainty, or regulatory crackdowns, investors routinely convert volatile altcoins back into Bitcoin. Bitcoin is widely viewed as the digital asset class’s ultimate settlement layer and store of value, causing BTC.D to rise even if Bitcoin’s dollar price stays flat or declines moderately.
-
Risk-On (Yield Seeking): During extended bull runs, when Bitcoin’s market capitalization becomes large and its volatility slows down, traders seek higher risk-reward profiles in lower-cap altcoins, driving BTC.D downward.
Structural Capital Inflows (ETFs and Corporate Treasuries)
The growth of regulated Spot ETFs and public corporate treasury strategies (pioneered by entities like MicroStrategy) creates asymmetric demand. Because traditional institutional capital flows overwhelmingly into Bitcoin first before trickling into derivative vehicles, large institutional buying surges directly strengthen BTC.D.
Token Inflation and Supply Expansion
Thousands of new altcoins launch every year. As networks unlock vested tokens and launch fresh projects, the global pool of altcoin market capitalization expands organically, placing long-term downward pressure on BTC.D unless Bitcoin experiences proportional price appreciation.
Bitcoin Dominance and Market Cycles
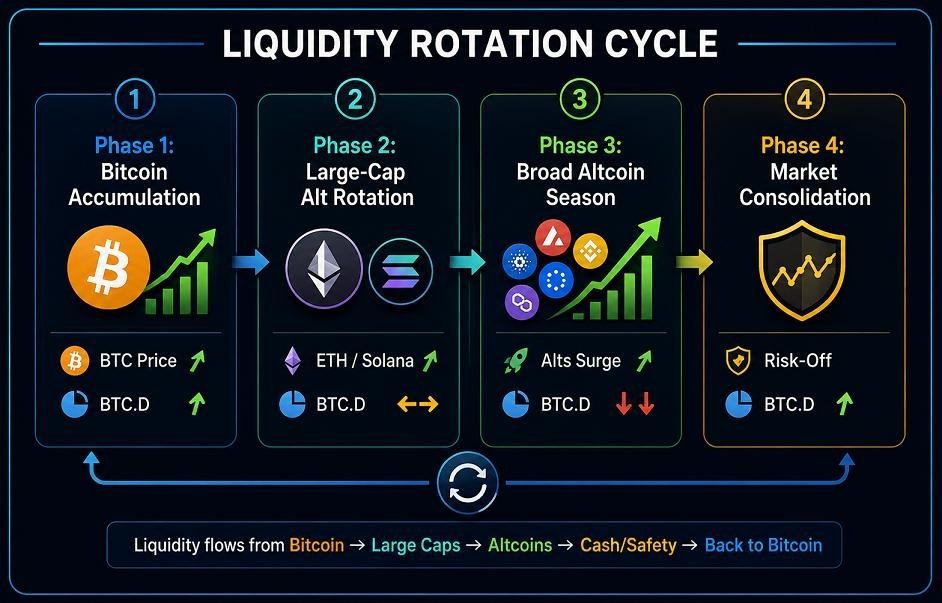
A traditional crypto market cycle generally moves through four distinct liquidity phases:
-
Phase 1: Bitcoin Outperformance. Capital enters the market primarily via Bitcoin. Price rises, confidence builds, and BTC.D trends upward.
-
Phase 2: Ethereum & Large-Caps. As Bitcoin consolidates near local highs, profits flow into major smart contract platforms (e.g., ETH, SOL). BTC.D stabilizes or begins a mild drop.
-
Phase 3: Altcoin Season (Altseason). Capital rotates down the risk curve into mid-cap, low-cap, and speculative sectors. Altcoins appreciate rapidly against both USD and BTC, causing BTC.D to fall sharply.
-
Phase 4: Reset & Capitulation. The macro trend cools down. Speculative assets lose liquidity first, capital runs to fiat or stablecoins, and surviving funds retreat into Bitcoin, resetting BTC.D higher for the next cycle.
How Traders Use BTC.D to Navigate the Market
Traders rarely view BTC.D in isolation; instead, they combine BTC.D trend analysis with Bitcoin’s price direction to build actionable market bias:
| Bitcoin Price Direction | BTC Dominance Direction | Market Implication | Recommended Strategy Focus |
| Rising (↑) | Rising (↑) | Strong Bitcoin rally; alts lagging behind | Focus heavily on BTC exposure |
| Rising (↑) | Falling (↓) | Full-scale Altcoin Season; alts beating BTC | Overweight high-conviction altcoins |
| Falling (↓) | Rising (↑) | Market crash; alts bleeding faster than BTC | Move to cash/stablecoins or hold BTC |
| Falling (↓) | Falling (↓) | Total outflow; capital fleeing crypto entirely | Strict risk reduction; prioritize capital protection |
| Sideways (→) | Falling (↓) | Safe rotation; steady BTC enables alt gains | Trade breakout patterns in top altcoins |
Limitations and the Modern “Stablecoin Distortion”
While BTC.D remains an indispensable macro benchmark, modern financial innovations have introduced structural noise into the metric.
The Stablecoin Issue:
Fiat-backed stablecoins (such as USDT and USDC) now account for over $150 billion to $200+ billion in total market capitalization. Because stablecoins are categorized as “altcoins” in total crypto market cap aggregations, a growing supply of dollar-pegged assets naturally pulls BTC.D downward—even when no capital is actively flowing into volatile altcoins.
To address this, institutional researchers frequently track Stablecoin-Adjusted Bitcoin Dominance, which removes non-volatile pegged assets from the denominator. Removing stablecoins typically raises Bitcoin’s true market dominance metric by 5 to 8 percentage points.
Conclusion
Bitcoin Dominance is much more than a simple percentage on a chart; it is a live reflection of market sentiment, liquidity distribution, and institutional participation across the cryptocurrency sector.
While the growth of stablecoins and token issuances has added nuance to how the metric is calculated, tracking BTC.D alongside spot market price action remains one of the most effective ways to spot cycle shifts, protect capital during market downturns, and capitalize on rotational altcoin opportunities.
Frequently Asked Questions
What does 60% Bitcoin Dominance mean?
A 60% Bitcoin Dominance level means that 60% of the entire cryptocurrency market’s aggregate market capitalization resides in Bitcoin, while all other altcoins, tokens, and stablecoins combined account for the remaining 40%.
What is a good Bitcoin Dominance level for Altcoin Season?
Historically, a broad “Altcoin Season” occurs when Bitcoin Dominance drops steadily below 50% to 55% while total crypto market cap is expanding. This indicates that capital is flowing into non-Bitcoin assets faster than into Bitcoin.
Does a falling Bitcoin Dominance mean Bitcoin’s price is dropping?
Not necessarily. Bitcoin’s price can rise while dominance falls if altcoins are rising at a faster percentage rate. Dominance measures relative market share, not absolute USD value.
Why are stablecoins skewing the BTC.D metric?
Because stablecoins like USDT and USDC are counted within the “total crypto market cap” denominator, any increase in stablecoin supply artificially lowers Bitcoin Dominance, even if investors are holding fiat-backed cash rather than buying altcoins.
Where can I live-chart Bitcoin Dominance?
Most financial charting platforms, including TradingView (under the ticker BTC.D), CoinMarketCap, and CoinGecko, provide live, streaming charts of Bitcoin Dominance.
About The Author